
Beyond the Spreadsheet
Why SharePoint Lists are the true "Excel on Steroids" for your data
For decades, Excel has been the default tool for making calculations, doing projects, managing inventories, and organizing data. It is what we know, quite powerful, and accessible to all. In fact, the majority of the known world still relies on Excel which says a lot! But now that we are in an era where multiple people are collaborating, editing the same spreadsheet simultaneously, the traditional Excel can't cope. Data gets overridden. formulas break, rows get accidentally deleted, version control descends into chaos, and tracking "who changed what" becomes a difficult task.
Enter SharePoint Lists. Far from being just a secondary feature tucked inside Microsoft 365, a SharePoint List is essentially "Excel on Steroids". It provides the structured, user-friendly interface of a spreadsheet but backs it with the security, relational integrity, and automation of a true relational database.
A SharePoint List looks exactly like an Excel worksheet. You have rows, columns, and a clean grid view. But under the hood, the capabilities go well beyond. Data inputted into the grids have the potential to be connected to other lists (without VLOOKUP's), lists on other site collections, and even back to Excel spreadsheets through Power Apps.
When you create a list, you need to pay attention to how you setup columns, since this will be key to how to end up defining exactly what type of data belongs there. Notable ones are:
Single line of text or Multiple text - Exactly as it says on the tin. Just text and nothing more. Single line has limitations of characters, obviously. Probably the most bog-standard of column types.
Choice These provide predefined choice options which allows dropdown or choice selection menus which ensures data entry remains consistent. You have options to have multiple selections, but this may prove problematic when you want to do filters since "choice groups" will become a unique item.
Person Not just a name, but this is linked to the M365 profile connected directly to your organization’s Microsoft 365 profile directory, detailing full names, titles, emails, and org charts.
Lookup columns Allows you to pull data dynamically from an entirely separate list, establishing relational database connections. Especially useful when using one list as an "unchangeable" variable, such as country or city.
Calculated Columns Non-editable columns that have calculations baked into them. So that you can do "column A + column B" type calculations, but well beyond obviously.
Metadata Linked to Term Store Management sets that have been predefined. This draws data from a global source that is tenant-wide. Obscenely powerful if your organisation deals with a global data set and can link to multiple lists and sites.
SharePoint Lists completely outdoes Excel when it comes to visual presentation. Using native Column and View Formatting, users can apply conditional formatting without writing complex macros or lookups. With a few clicks, you can turn a simple status column into vibrant, color-coded pills, display progress bars based on numerical values, or render entire list views as Kanban boards, calendars, or gallery cards. In addition, you can also link the data to Power BI for even more abilities like graphs and dashboards.
The Interface: Why It’s "Excel on Steroids"
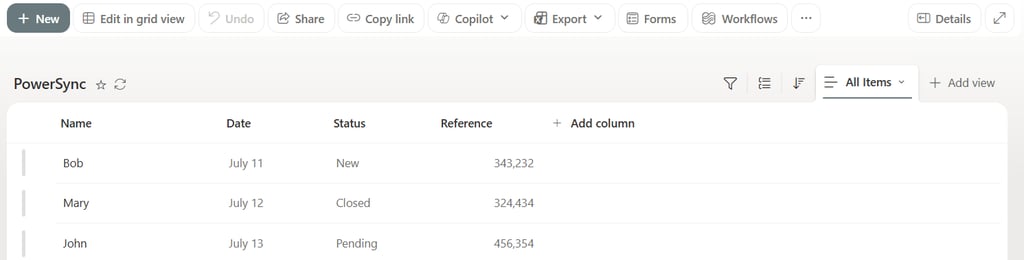
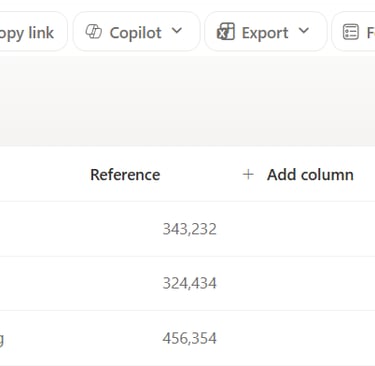
In a shared Excel spreadsheet, adding a new entry means scrolling to the bottom of a massive grid, inserting a row, and hoping you don't accidentally overwrite someone else’s active cell. SharePoint Lists elegantize this process through a dedicated "Add New Item" experience.
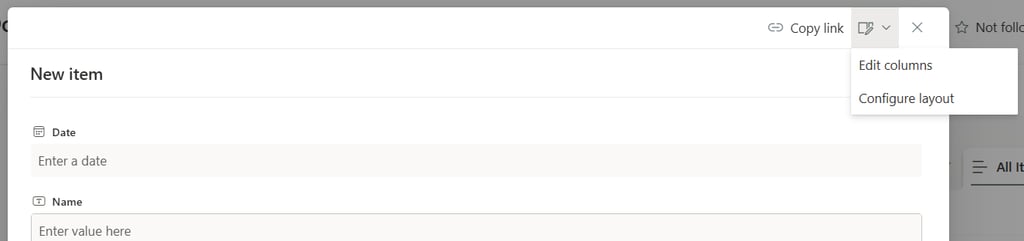
Clicking the "New" button slides open a clean, vertical data-entry pane on the right side of the screen. This panel instantly acts as a structured barrier between the user and the raw dataset. You can also configure the way this look and also apply formulas to data fields.
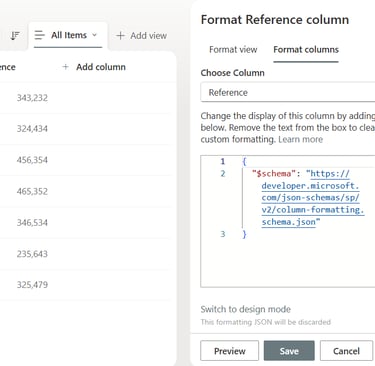
The true power lies in how you can customize this form panel. Using Microsoft's JSON header and footer formatting, administrators can transform a boring, standard form into a tailored corporate experience. You can insert custom headers, break long forms into collapsible, logical sections, and use conditional logic to hide or show specific fields based on what the user selects in previous dropdowns. It turns a raw data entry task into an intuitive, guided wizard.
The new "Add New Item" Experience

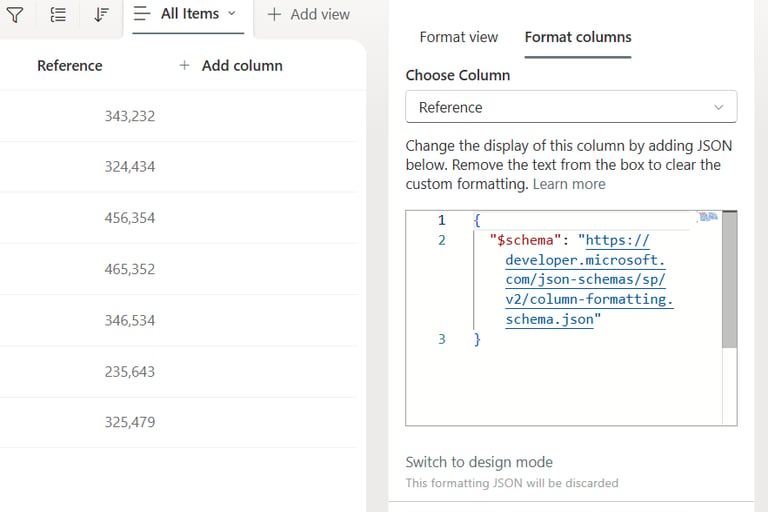
If the native side-panel customization isn't enough, SharePoint Lists feature a direct integration with Microsoft Power Apps. By clicking "Customize with Power Apps" in the form ribbon, you can completely replace the standard data-entry panel with a bespoke web application interface.
With a customized Power Apps form, you can:
Enforce complex, multi-stage validation rules before data is submitted.
Embed corporate branding, logos, and custom layouts that span multiple columns or tabs.
Pull live contextual information, such as automatically detecting the user's manager via Office 365 Users connection and pre-filling approval routing fields.
This bridges the gap between basic data collection and enterprise-grade software design. Users interact with a pristine, unbreakable app frontend, while your data is securely stored in the structured SharePoint List behind the scenes.
Advanced Power Apps Forms: Ultimate Control
Transitioning a team from Excel to SharePoint Lists doesn't mean leaving Excel behind entirely. Microsoft built powerful, bidirectional integration bridges between the two platforms.
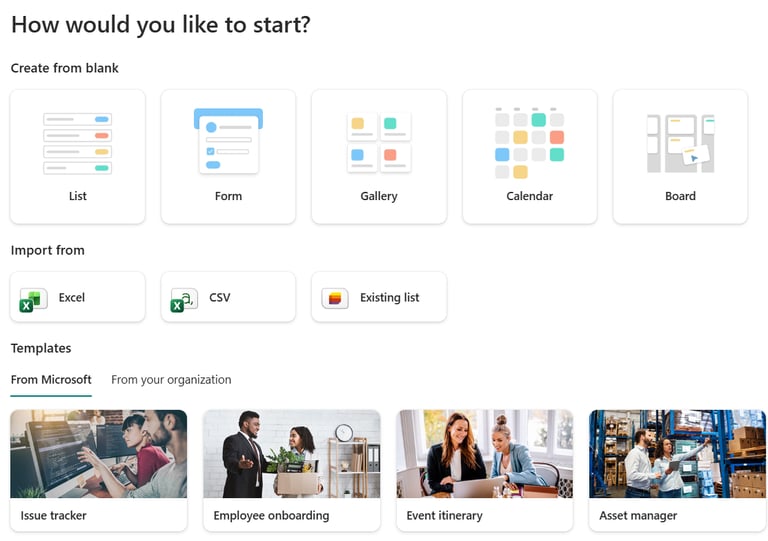
If you have a well-structured Excel Table, you can export it directly into a new SharePoint List in seconds using the "Import from Excel" feature. SharePoint automatically parses your headers and attempts to guess the correct data types for your columns.
Conversely, if you need to run deep data analysis, generate pivot tables, or build complex charts, you can click the Export to Excel button in your SharePoint List. This creates a live, data-connected spreadsheet. When your team updates, adds, or deletes items in the SharePoint List, anyone opening that Excel workbook can simply click "Refresh All" to pull the latest real-time dataset instantly.
Seamless Data Synchronization: Linking with Excel Tables
While SharePoint Lists are incredibly versatile, they are not without limitations. To build stable, reliable, long-term tools, users and administrators must understand and work around several hard platforms constraints.
The 5,000-Item Threshold
The most infamous limitation is the 5,000-item view limit. It is vital to understand that a SharePoint List can actually hold up to 30 million items. However, SQL database indexing rules prevent SharePoint from rendering or querying more than 5,000 items in a single view at one time without a severe performance hit.
How to bypass it: To keep your list functional past 5,000 rows, you must proactively set up Indexed Columns on fields you filter by (like Date or Status). Once indexed, you can build filtered views that only display a subset of data (e.g., "Only Active Projects"), keeping the visible count well below the 5,000 threshold.
Column Creep and UI Freezing
Because it is so easy to add columns, lists often suffer from "column creep." If you build a list with dozens of columns, the user interface begins to degrade. Specifically, when a user scrolls horizontally across a wide list, SharePoint is forced to lock and freeze the First Column (usually the "Title" field) by default so you don't lose context. If your columns contain complex JSON formatting or heavy lookup data, this freeze mechanic can cause noticeable visual stuttering and lag on lower-spec machines.
Infinite Scroll Fatigue
Unlike Excel, which handles thousands of rows via a smooth physical scrollbar, SharePoint Lists use "Asynchronous Pagination" (infinite scroll), which happens because the list needs to "load" additional rows, which can be a major pain. As you scroll down, the system continuously fetches data in batches of 30 to 100 items. If a user tries to scroll rapidly through thousands of items to find a row manually, the interface will continuously halt to show loading spinners. It forces a cultural shift: teams must learn to rely on built-in Search and Filter bars rather than scrolling blindly.
The Unforgiving "Quick Edit" Mode
SharePoint features a "Grid View" (formerly Quick Edit) that mimics Excel's bulk copy-and-paste behaviour perfectly. While incredibly convenient for updating 50 rows at once, it requires 100% data perfection.
Because SharePoint enforces rigid data types, pasting data that violates column rules will instantly cause system errors. For instance, if you accidentally paste a text string into a Date or Number column, or misspell a choice option, the entire row edit will lock up, flashing red error indicators. Unlike Excel, which silently accepts bad data, SharePoint will halt the save process until the data is manually corrected to meet perfection.
Limitations of Lists
If your data tracking involves a single user running heavy statistical modeling, mathematical financial forecasts, or massive bulk data manipulation, then stick to Excel.
But if your goal is collaborative data collection, building multi-user project trackers, triggering automated Power Automate approval emails when an item changes, or creating a secure, auditable tracking system for a team, SharePoint Lists win. By using the architecture within its known parameters, you gain an unbreakable ecosystem that scales beautifully across your organization. But be cautious of scale, because if your operations scales too big, then it is prone to failure.
The Verdict: Switch or not?
Start Doing AI
Go to
Home
Articles
About
Contact
Disclaimer
Privacy
© 2026 Start Doing AI. Not affiliated with Microsoft or Google
PowerShell-first documentation
Contact: vwh187@gmx.co.uk
Phone: 07891234728